Benchmark
![]()
Benchmark |
|
Now it's time to enter the fuel flow data. Before you begin, check to make sure the Benchmark preferences use your choice for engine power and fuel flow. This is a tedius process and you don't want to do this twice. Begin by entering the fuel data. It is best to start by entering the most extreme points in the data, say the maximum flow for the maximum rpm, then the minimum flow for the minimum rpm, then the minimum flow for the maximum rpm. You are entering data for a three-dimension 'shape' and it's best to let Benchmark 'see' the shape from the beginning. The curve fitting in Benchmark needs a lot of data points to create a smooth curve. As you begin to enter data points, Benchmark will automatically add other points for zero flow at the friction hp of the rpm and for a fuel flow at zero rpm. Of course, these are nonsense points in terms of the actual fuel flow of the engine, but it's important that the mathematical model be smooth. Thus, the mathematical model will go off into areas that the engine could never run. But don't worry about this, we are only trying to enter the data and get smooth curves. When you enter the minimum number of data points, Benchmark will start to draw the chart, but on the first time it will not do a good job. Just Save and the screen display will clear up. Continue to add all of the points for the mixture setting. As you do this, Benchmark will continue to automatically add points for zero flow, zero power and zero rpm. If you make a mistake and add a point that is all wrong, you can change the point, or select it and delete it. However, Benchmark will continue to automatically add points where no zero flow/power/rpm points exist. If you find yourself in the difficult situation where you want to delete some points but Benchmark is fighting you by adding points, you can defeat the auto-add-point mechanism by selecting Edit Fuel Data. When you are in edit fuel data mode, you can delete and edit any of the data points and the auto-add-point mechanism is turned off. |
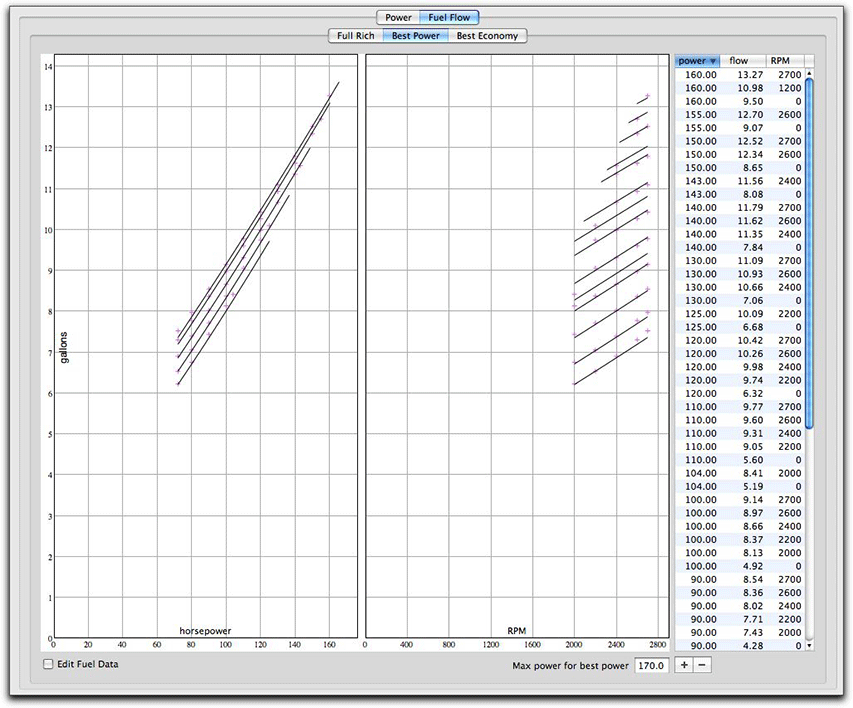
The fuel flow data is shown as a function of power and rpm, thus it is a three-dimensional chart. As before, the fuel flow model is shown with black lines and the original data points are shown in violet. To produce smooth curves, Benchmark needs more data points than the ones you can get off the engine manufacturer's charts. As you enter the fuel data points, Benchmark adds more points to keep things smooth, however, Benchmark does not show these reference data points in the normal display shown above. To see these points, and to interactively change any of the data points, choose Edit Fuel Data. |
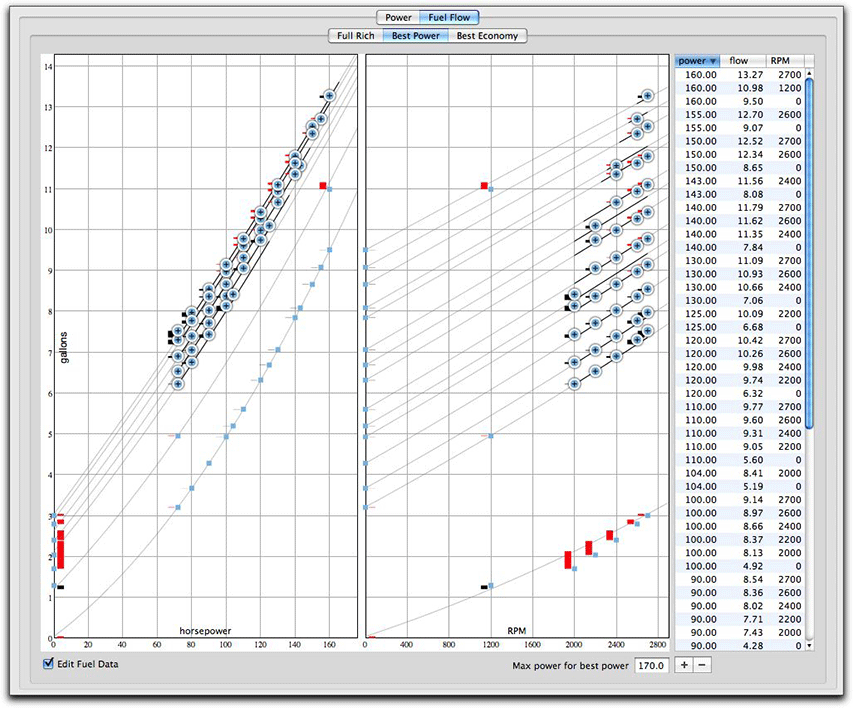
The normal data points are shown with the blue indicators, just like the engine power points, and the reference data points are shown with a small square blue handle. Error bars are shown by each to show whether the point is above the model (black error bar) or below the model (red error bar). Light gray lines show the engine model for the full range of the chart. The black lines for the model only extend within sensible limits. In the flow-vs-power chart, the model lines begin at the lowest power data points and are limited at the right end by the maximum horsepower for the rpm. For this, Benchmark uses the same maximum power function of the engine model. On the flow-vs-RPM chart, the minimum rpm for the engine (typically 2000) is used as well as the maximum power for the rpm, and these model lines are limited at the right side by the maximum rpm (red line) of the engine. As you add data points, Benchmark adds additional reference points. For each engine rpm, Benchmark adds a reference point for a fuel flow of zero at a negative power calculated by the friction power of the engine model. If you change the friction power curve, these points will be adjusted automatically by Benchmark. While you can edit them, it's pointless to do so because Benchmark will immediately recalculate these points. Benchmark will also add a reference flow data point for zero power. These are created to give you a handle to move around. Once the points are established, Benchmark will not change them. Benchmark will also add a reference flow data point for zero RPM for each power. These are created to give you a handle to move around. Once the points are established, Benchmark will not change them. However, as discussed above, Benchmark does not automatically add points when you choose Edit Fuel Data. You may also find that you may need to add a few more reference points (as shown above for 1200 rpm). You can set the fuel flow units to gallons, pounds, liters or kilograms in Benchmark preferences. |
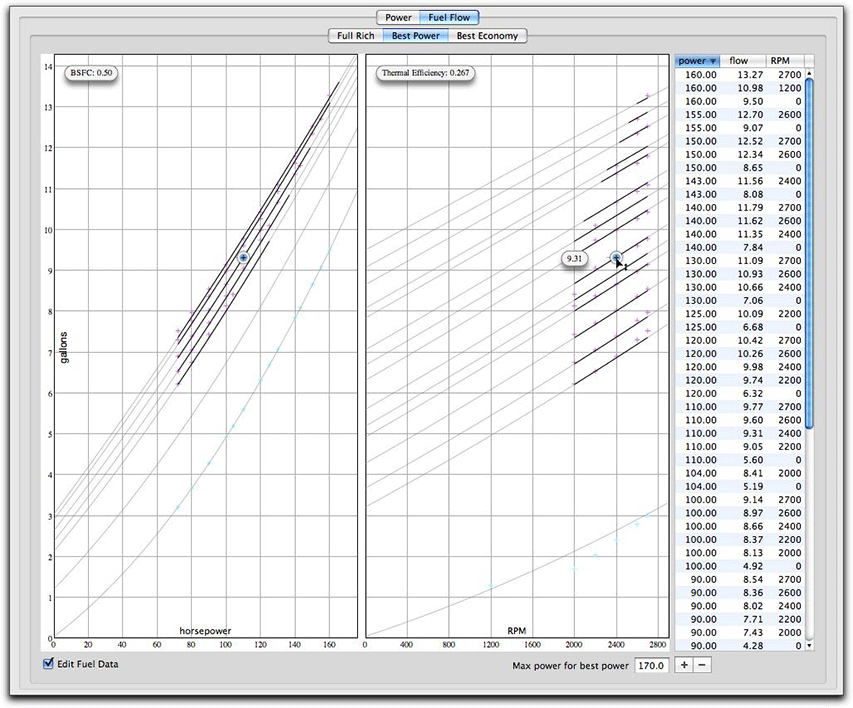
When you move the cursor over one of the points, the cursor changes to the display shown above and you can drag the point up or down. In addition to showing the fuel flow, it also shows the brake specific fuel consumption (BSFC) and thermal efficiency. Depending on the fuel flow unit of measurement, BSFC is given in pounds/hp/hr or grams/kW/hr. |

![]()
|
|