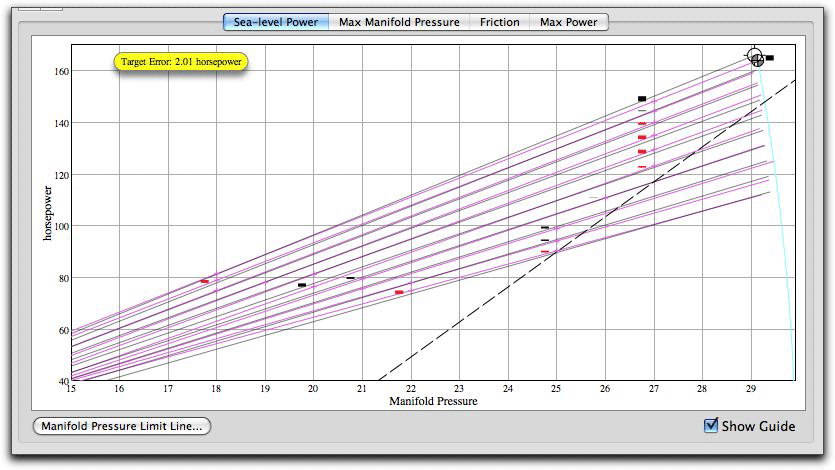
Select Show Guide to get a better appraisal of your model.
There are error bars at each data point, black when the model lines are above the data lines, and red when they are below.
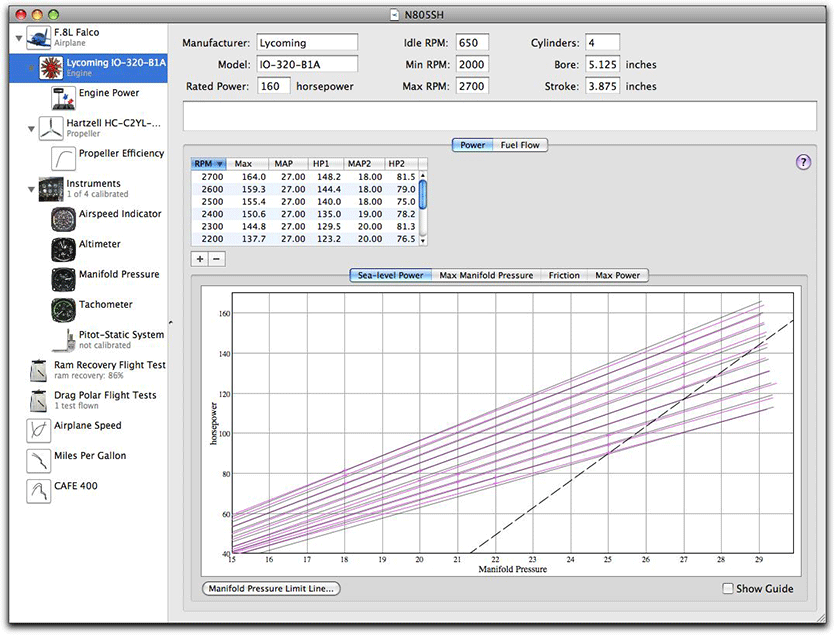
On the far right, there is a guideline showing the maximum manifold pressure beginning at 29.92 at 0 rpm and curving upward with the increase in engine rpms. All evidence and basic physics suggest that the maximum manifold pressure will decrease with the square of the engine rpms, in the same way that drag goes up with the square of an airplane's speed.
At the top of the chart, we have a target. This is the highest point on the highest rpm line, and it's the point that essentially defines the power of the engine. In order to create an engine model with realisticly smooth curves, Benchmark treats this target and the engine power line at the highest rpm as 'sacrosanct' and it will not change this at all. All adjustments are on the other points in the engine power chart. |