Performance Testing 101
![]()
Performance Testing 101 |
|
by Alfred Scott
In the early 1940's, the Boeing Aircraft Company had just finished building the B-17 bomber, and to fulfill the requirements of the Air Force, Boeing needed to supply a flight manual that would show the performance and range of the airplane at various weights and power settings. With long-range bombing missions, it would be essential that the crew could accurately predict the speed and fuel consumption of the aircraft—and could also tell what would be the most efficient power setting for any altitude, temperature, and aircraft weight. Prior to that time, most performance charts for aircraft flight manuals were developed with the empirical method. The aircraft was flown in various regimes, the performance data was duly noted on graph paper, and then an engineer would take a flexible ruler and draw some curves that seemed to be the most likely average. But the B-17 required more accuracy than that—after all, there weren't likely to be a lot of friendly FBO's and alternate airports scattered along the way. The Boeing engineers had to know the characteristics of the airplane. Because there was no way to determine the efficiency of the propellers, Boeing's test pilots took the plane to 20,000 feet, shut the engines off and ran the plane through a time-honored glider-test procedure. The absurdity of this did not escape notice of Boeing's management, who asked the Flight and Aerodynamics Department to see if they could develop a better method. A small team of engineers, under the direction of Edmund T. Allen, developed a mathematically rigorous method of performance testing and analysis that was used for the B-17, B-29 and other aircraft during WWII. This method was described in the January 1943 Journal of Aeronautical Sciences. The method is precise, has stood the test of time and technological improvements, and is the method that is used by virtually all of the major aircraft manufacturers to obtain performance data on their aircraft. The most important product of this process is the 'miles-per-gallon chart'—a graph which shows all of the most efficient power settings for various weights and temperatures at a given altitude. Simply put, the miles-per-gallon chart tells you all you need to know about the aircraft to select a power setting that will give you the most efficiency. Under the direction of Roy LoPresti, Mooney Aircraft was the first to offer a miles-per-gallon chart in the flight manuals of the 201 and later the 231. Roy recognized that Mooney pilots were fanatical about fuel efficiency, and he hired an aeronautical engineer, Fen Taylor, to do the flight testing, analysis and charting. Fen Taylor is widely recognized as one of the world's experts on this subject, indeed he was a member of Ed Allen's original team of engineers at Boeing that 'wrote the book' on the method. Fen's wife, Dorothy, is also an engineer, and they work together as consulting engineers on performance testing and analysis. If the performance section of the flight manual for your production aircraft was not done by the Taylors, then chances are the engineer who did the manual once sat at Fen Taylor's feet and learned the method from him. I became interested in all of this in the mid-eighties. With the Falco, there were no good performance charts available, and I wanted the builders of our aircraft to have performance charts that were as good as those offered for any production aircraft. There was the added problem that no two Falcos performed exactly the same—some had full gear doors and other refinements and were exceptionally fast, while others were 20 and 30 mph slower. So I approached Fen Taylor and hired him to school me in the method. I didn't want him to test a Falco, but rather 'give me the tools' so that we could test the aircraft ourselves. At the time, I had no concept of what I was getting into or even what was involved. Oh, was I naïve! Fen and Dorothy prepared a thick engineering report and when it arrived, I almost cried. Fen, Lord love him, is one of those people who understands a subject intimately but who can barely explain it. The report was a bewildering collection of look-up charts, formulas and frightfully complex explanations. It seemed almost beyond humankind to understand it. But I wore that guy down and made Fen explain it all to me. We had endless conversations as I pieced it all together. And slowly as I came to understand the method, the awful truth sank in—it was useless to any normal person. The problem is that once you've done the flight testing—which is fairly easy—you have to spend an enormous amount of time analyzing the flight data to be able to draw the charts. Roy LoPresti told me it took a couple of engineers three months just to do the 201. "Didn't you ever use a computer for any of this?" I asked Fen. "Well, not really because it wouldn't help that much. There are all these things along the way that you can't solve on a computer, so we just used look-up charts for all of it." This didn't seem to make much sense to me, so I kept pressing for the equations for each step of the process. There were three principal stumbling blocks—propeller efficiency, engine power, and fuel flow—which prevented computers from being used to automate this process. For these I turned to Jim Petty, a Falco builder who during the day worked as a program manager for advanced technology at the USAF's Wright-Patterson Research Center. Jim Petty is a mathocist. Tell him about a problem and simply out of interest he will work on it until he comes up with an equation or until his brain explodes. Over the years, I've hit him with very few problems that he couldn't solve—if you know how to do a parallel offset of a Bézier curve, lemme know!—but propeller efficiency, engine power and fuel flow have all been felled by his remarkable brain. And my contribution has been to put it all in a stand-alone computer program that handles the entire process and which spits out the miles-per-gallon charts like they were popcorn. The program is called Benchmark, and in a couple of hours with Benchmark, you can duplicate the entire analytical process that takes months when done the old way. So without getting into sleep-inducing math, let me take you through the methodology of this little-known branch of aeronautical engineering. The neat thing is that once you take away the horrendous math, the flight testing is not difficult at all. And it means that whether you own a Beech Staggerwing, a Cessna 185 on skis, a DC-3, a Lancair IV or even a Beaver on floats with a canoe strapped to the struts, you can easily crank out all the charts you'll ever need for your specific airplane, not a factory-average airplane. Instrumentation You need to calibrate the instruments. An instrument shop can do this for you, or you can do it yourself. The easiest do-it-yourself calibration is also the most important—the airspeed indicator is calibrated with a water manometer, and Benchmark has a calculator to assist you with the conversions. For best results, you should use a sensitive airspeed indicator. This is a two-handed instrument that looks something like an altimeter and reads in one-mph increments. Ideally, you will calibrate the airspeed indicator, tachometer, altimeter and manifold pressure gauge. You end up with a table of indicated-vs-actual data. In the manual method, you plot this on a chart, draw a line through the data points and then use this chart to make corrections. |
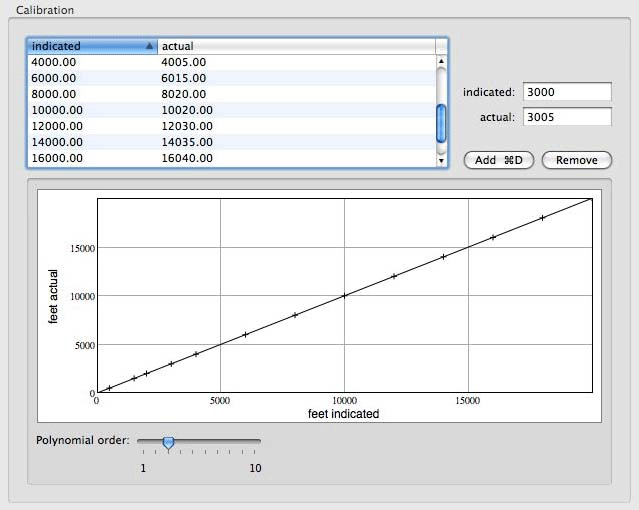
With Benchmark, you type in the numbers of indicated and actual and Benchmark will do a curve-fit of a polynomial. You pick the Polynomial Order for the best-fitting curve. This business of curve-fitting is central to how Benchmark works, because almost everything that is special about an instrument, engine or airplane is represented by a curve. The nice thing is that it's actually fun. And once the instruments are calibrated in Benchmark, the corrections of the data are handled automatically. The Propeller It's a three-dimensional chart—think of it as a hill—based on a couple of obscure parameters that are calculated from the specifics of the propeller, engine power, propeller rpm, airspeed, pressure altitude and temperature. You look up the efficiency of the propeller—the 'height of the hill' at that point—and then make a number of adjustments for some other things peculiar to propellers. |
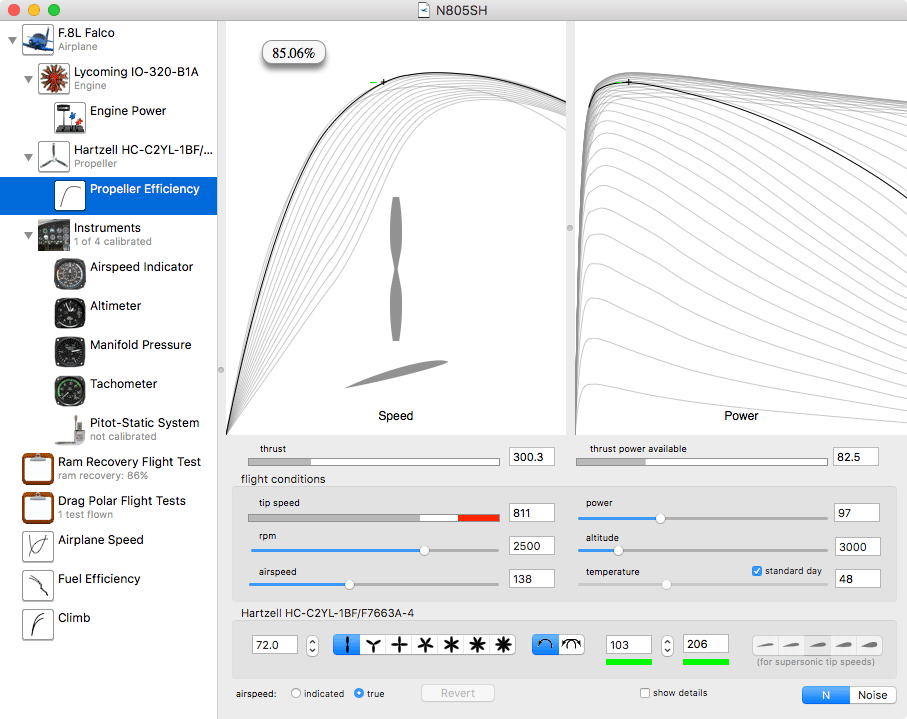
The propeller efficiency calculator in Benchmark This is handled automatically in Benchmark, and all you have to do is type in the basic data on the propeller—diameter, number of blades and blade activity factor. The activity factor is something you'll need to get from the propeller manufacturer, and it's roughly equivalent to a wing's aspect ratio but in the case of a propeller the tip is travelling at a much greater speed and thus needs some compensation. There's a lot of calculus in a blade activity factor, and you don't want to know about that. With this data in hand, Benchmark can then calculate propeller efficiency in a flash, and there's a propeller efficiency calculator so you can play with various settings, watch the numbers change and see where the propeller falls on the curve. It also enables you to go to parties and exhibit True Nerdism by discussing your equivalent helical tip speed and delta eta for total activity factor. |
![]()
|
|