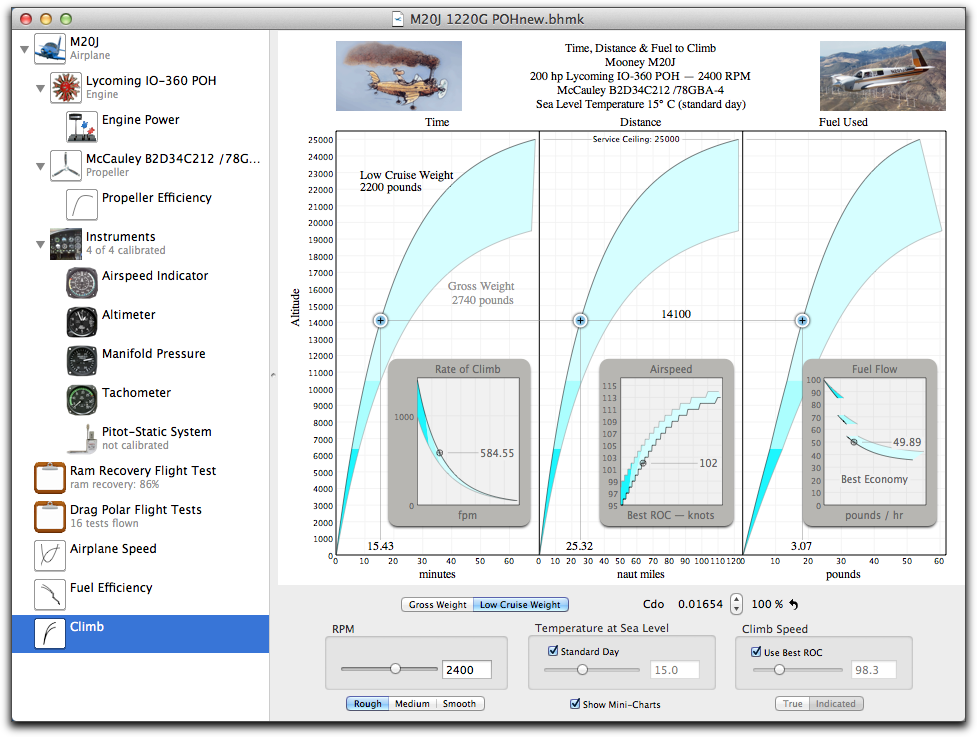
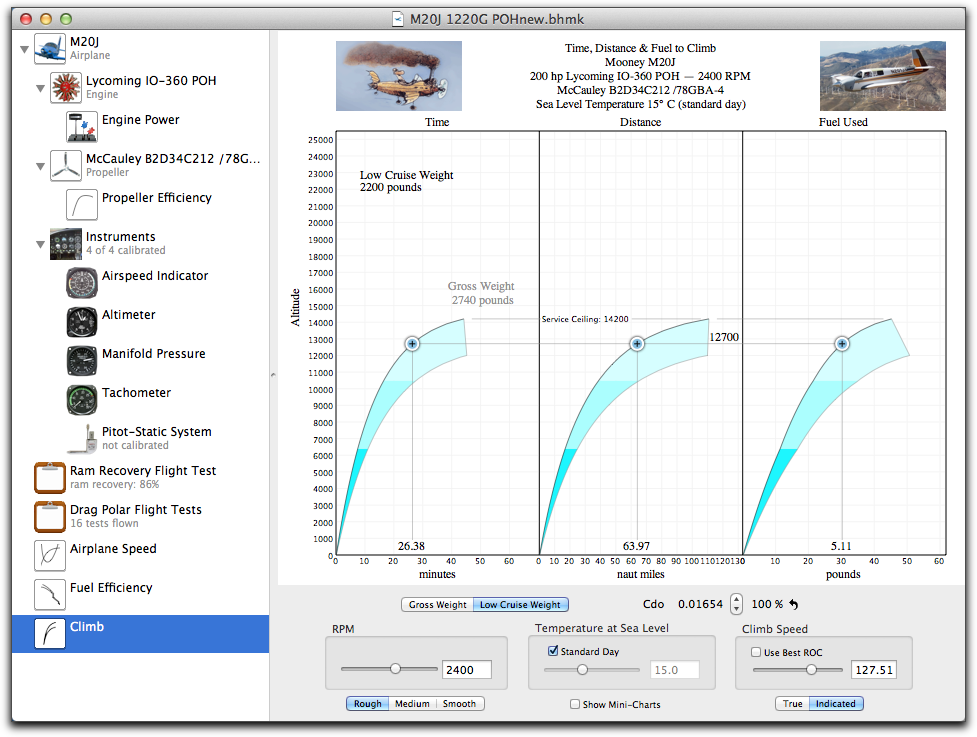
Climb Charts
Benchmark now has Climb charts that show the performance of the airplane for Time, Distance and Fuel Used. You can move the slider to find the data for the time, distance and fuel used to climb to a specific altitude. Benchmark also calculates the service ceiling.
The Low Cruise Weight is entered for the airplane and it is the empty weight plus pilot plus minimum fuel. Think of it as the lightest weight you would ever fly the plane at.
You have a choice of how many calculations are made and this results in smoother curves. For Rough, the speed calculations are at one-knot increments, for Medium it is 0.5 knots and for Smooth it is 0.1 knots (which produces beautifully smooth curves, but which is also slow to calculate). Best to use the Smooth setting only when you need to print a chart for a report. |